Peak Table LCMS
Extracting a peak table with data downloaded from XCMS Online
When you download results from XCMSonline, you will have an .zip file. Right click on this file in file explorer and select “Extract All” to produce a second folder with the same name that contains a range of data and outputs.
Next make sure you have
- a folder in your working directory (where your R project is located) called “Tidy_data”
- a folder in the same working directory (where your R project is located) called “Data” that contains your downloaded xcms results
- moved your unzipped folder from the XCMSonline download into this “Data” folder
- renamed the unzipped folder with a meaningful name (name of experiment, pos, MS type etc) if necessary. Use hyphens or underscores instead of spaces and non-alphanumeric characters
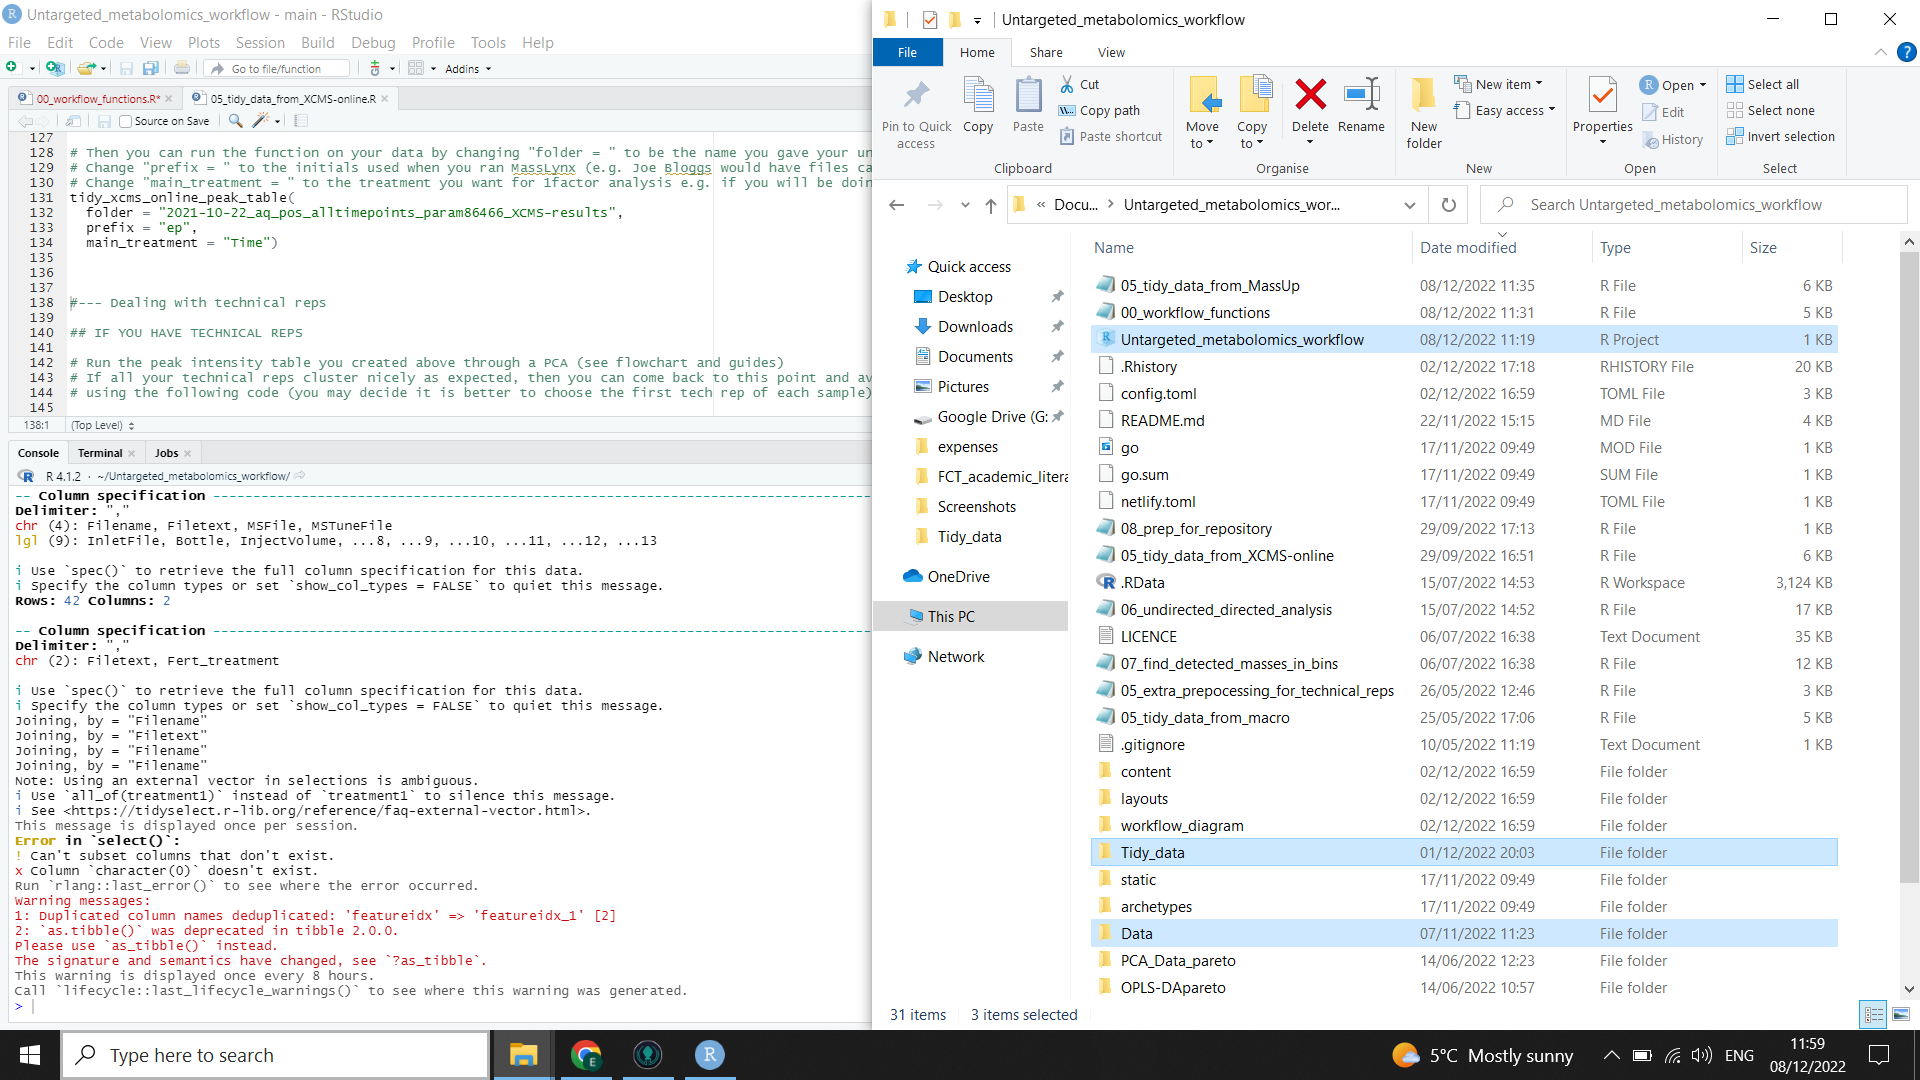
See the left side of the image below with highlighted files.
⚠️ These folder names are case sensitive!
The first thing we need to do in R is import all the libraries and functions we will need to run the code. I have put it all into one source code for the whole workflow to save space and avoid confusion for people who don’t like looking at code!
⚠️ you will need to manually install the following packages using
install.packages()or RStudio"tidyr", "tibble", "dplyr", "readr", "stringr", "ggplot2", "pcaMethods", "forcats", "vegan"
Then copy and paste this code into R and run:
source("https://raw.githubusercontent.com/LizzyParkerPannell/Untargeted_metabolomics_workflow/main/00_workflow_functions.R")
Then run the following code, inserting the name of the folder that you downloaded from XCMSonline between the "” (the one that you should now have saved in the “Data” folder, see above) You will also need to define the shared “prefix” of your sample names (filenames of the .mzML files you used in XCMSonline), and also tell R the “main treatment” (tell it one even if you are interested in more than one).
# Change "prefix = " to the initials used when you ran MassLynx or the common prefix of all your .mzML files (e.g. Joe Bloggs would have files called JB-051222-001.mzML etc)
# Change "main_treatment = " to the treatment you want for 1factor analysis e.g. if you will be doing 1factor analysis in metaboanalyst
# If you are interested in more than one factor, just put any one of your factors into "main_treatment ="

tidy_xcms_online_peak_table(
  folder = "",
  prefix = "",
  main_treatment = "")
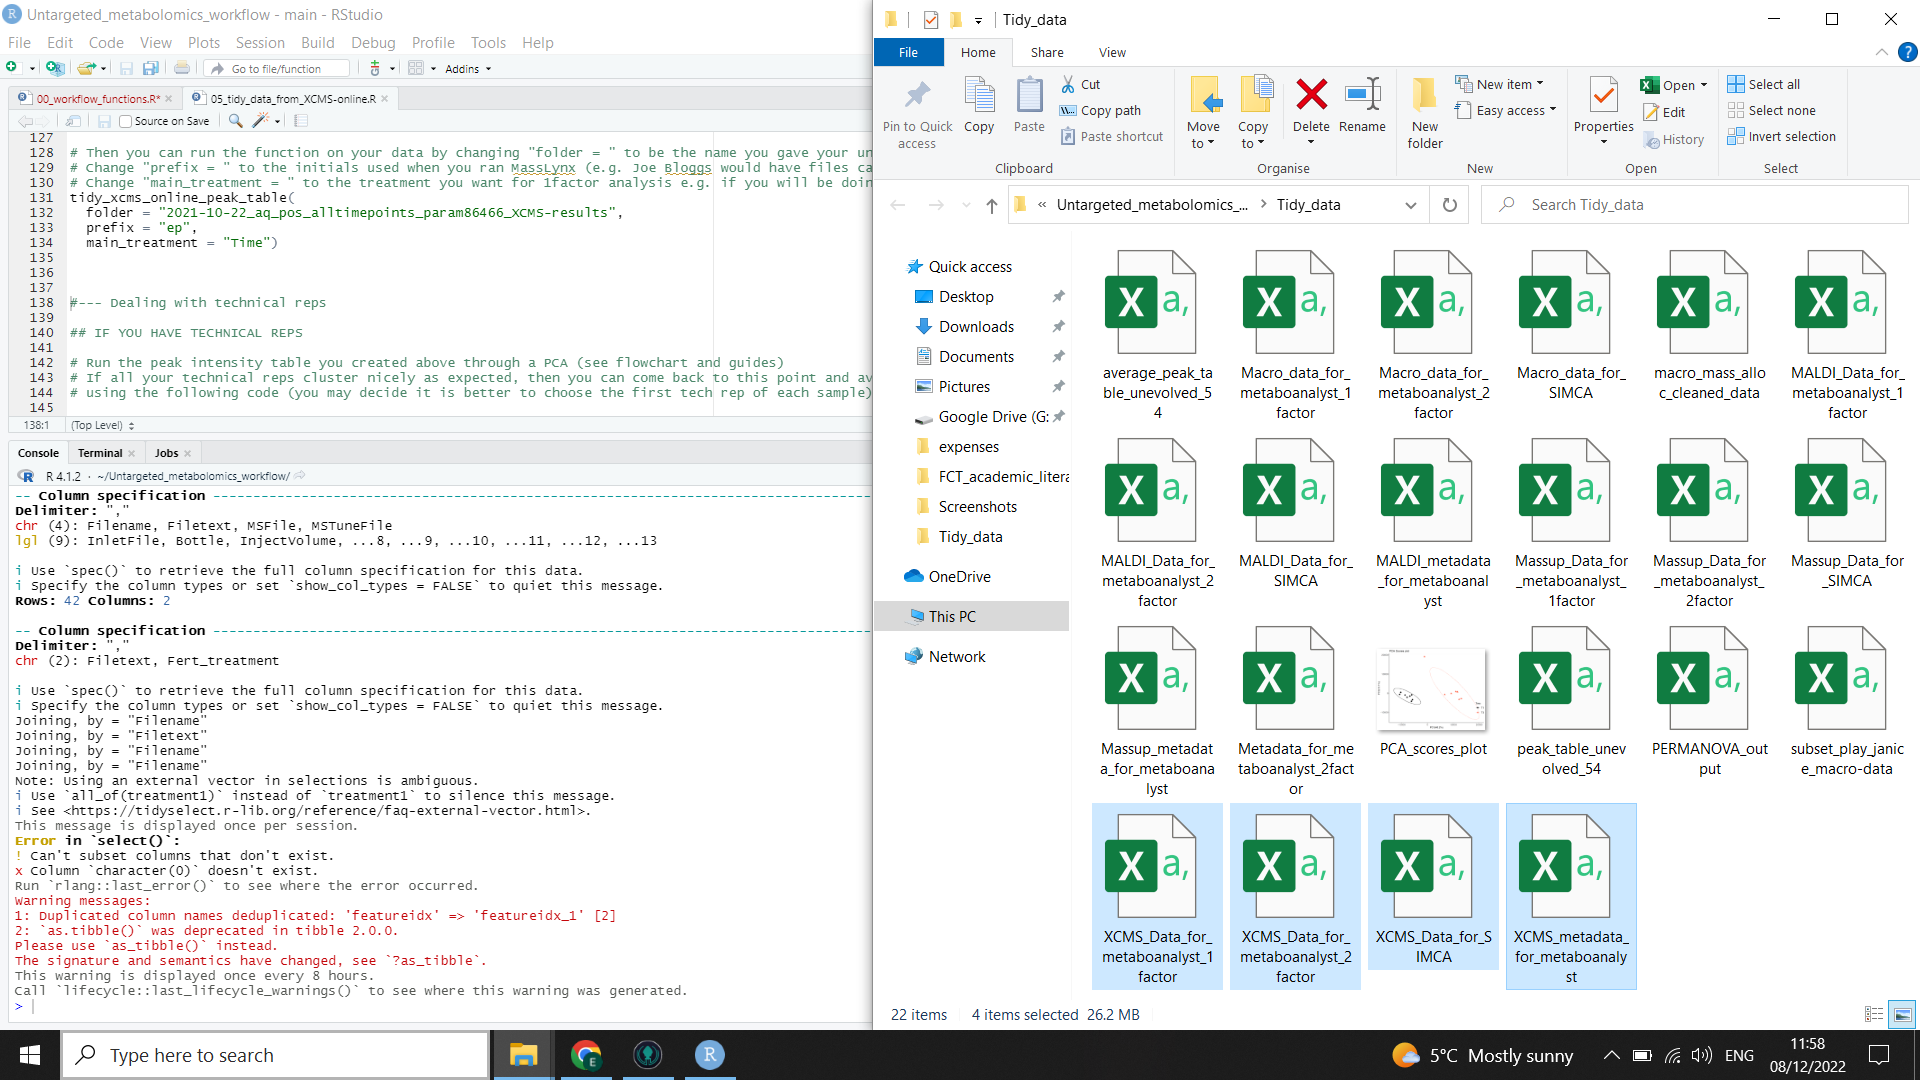
R will run the function for you, formatting the output from XCMSonline so that peak table can be used for different possible downstream tools and it will also add metadata where appropriate for the different tools. The output files are highlighted on the right in the image below (you will need to check file explorer to see that they have been created).
⚠️ You may get a warning in red in the R console (see the left side of the image below). This is normal.
⚠️ Check your files to see that the metadata has been carried across correctly. Make sure you have followed the guidance on metadata.
You now have peak tables ready for analysis.
⚠️ If you try to open these peak tables in excel, be aware that you probably won’t be able to view the whole file as excel has limits on the number of rows and columns