Peak table MassUp
Generating a Peak Table from MassUp Data
The first thing we need to do is import all the libraries and functions we will need to run the code. I have put it all into one source code for the whole workflow to save space and avoid confusion for people who don’t like looking at code!
⚠️ you will need to manually install the following packages using
install.packages()or RStudio"tidyr", "tibble", "dplyr", "readr", "stringr", "ggplot2", "BiocManager", "pcaMethods", "forcats", "vegan"
Then copy and paste this code into R and run:
source("https://raw.githubusercontent.com/LizzyParkerPannell/Untargeted_metabolomics_workflow/main/00_workflow_functions.R")
Next make sure you have a folder in your working directory (where your R project is located) called “Tidy_data”
Then run the following code, inserting the file path of the folder that you saved from MassUp between the "”
tidy_MALDI_peak_table("")
For example,
tidy_MALDI_peak_table("C:/Users/xxxxxxxx/Desktop/test_for_MALDI_data")
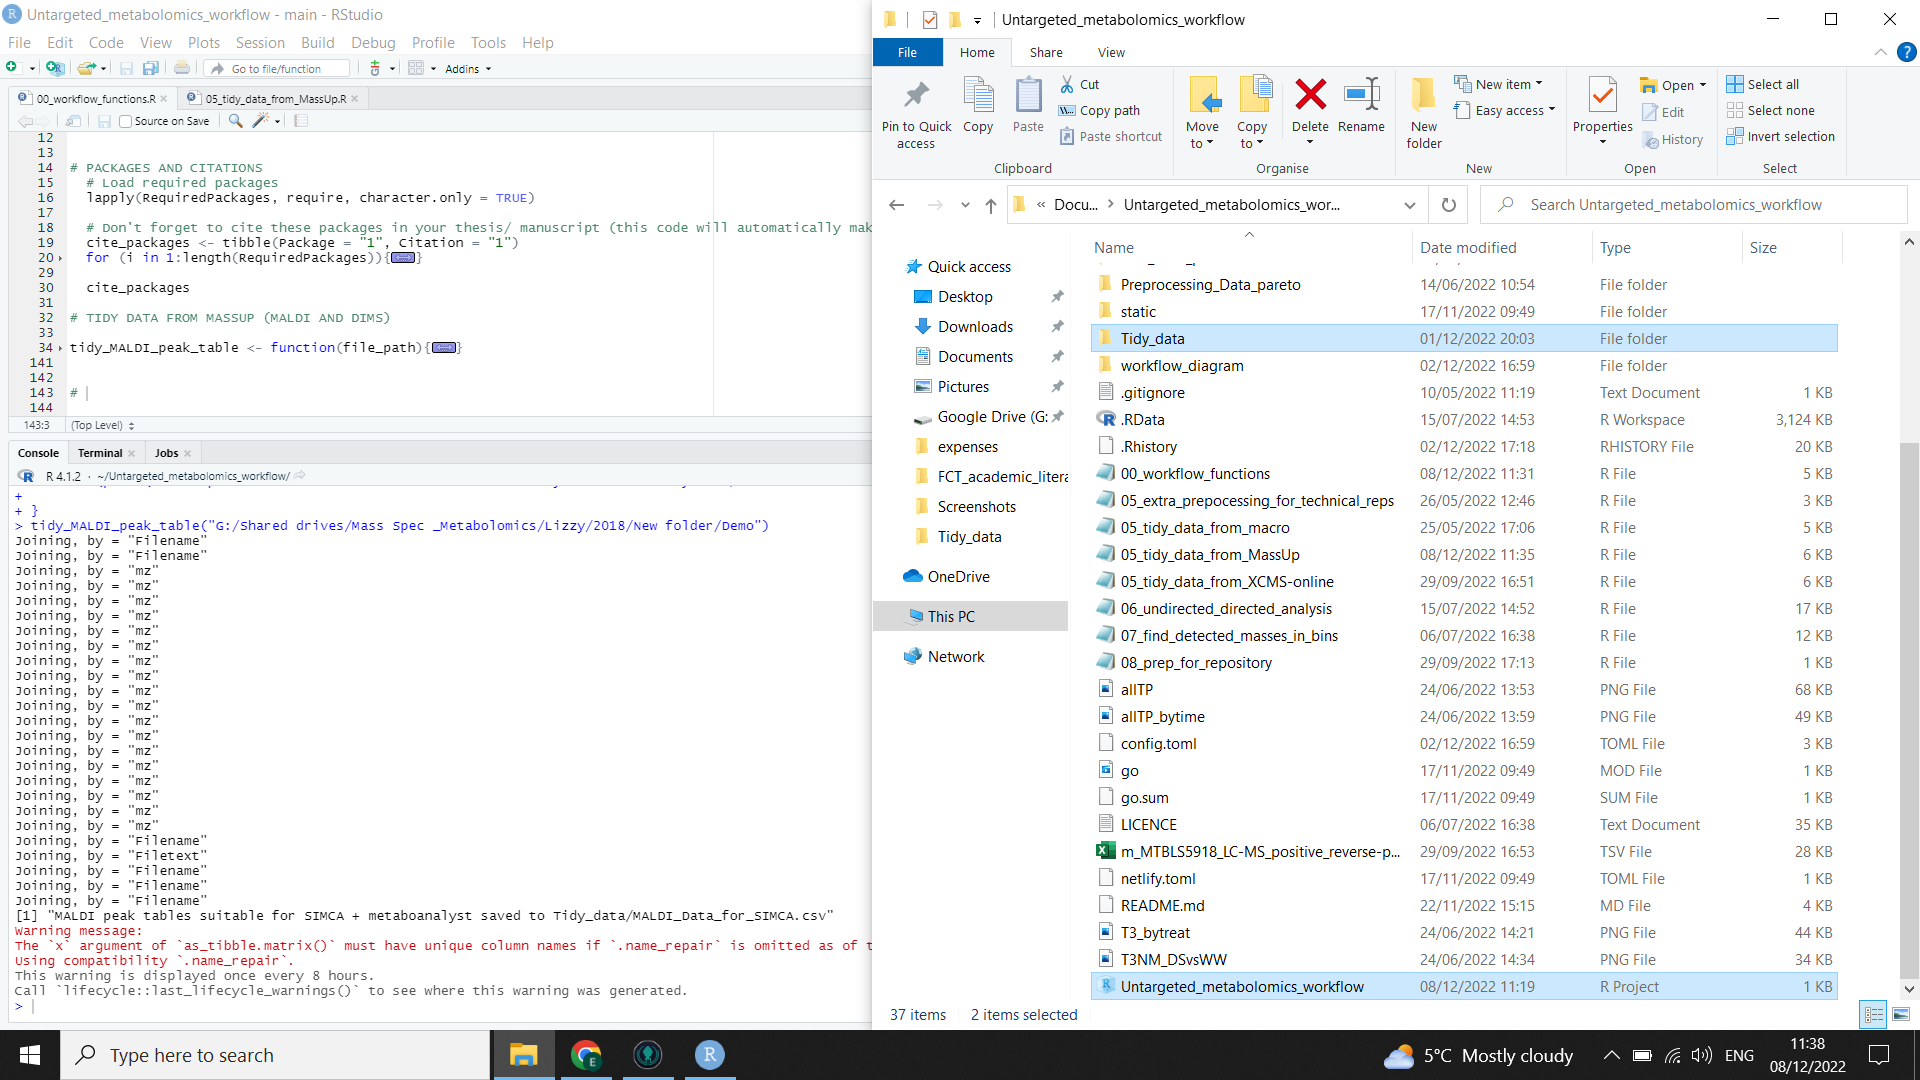
R will run the function for you, gathering the .csv files from each of your spectra and compiling them into one table. It will then format that table for different possible downstream uses and add metadata where appropriate for the different tools. The output files are highlighted on the right in the image below (you will need to check file explorer to see that they have been created).
⚠️ You may get a warning in red in the R console (see the left side of the image below). This is normal.
⚠️ Check your files to see that the metadata has been carried across correctly. Make sure you have followed the guidance on metadata.
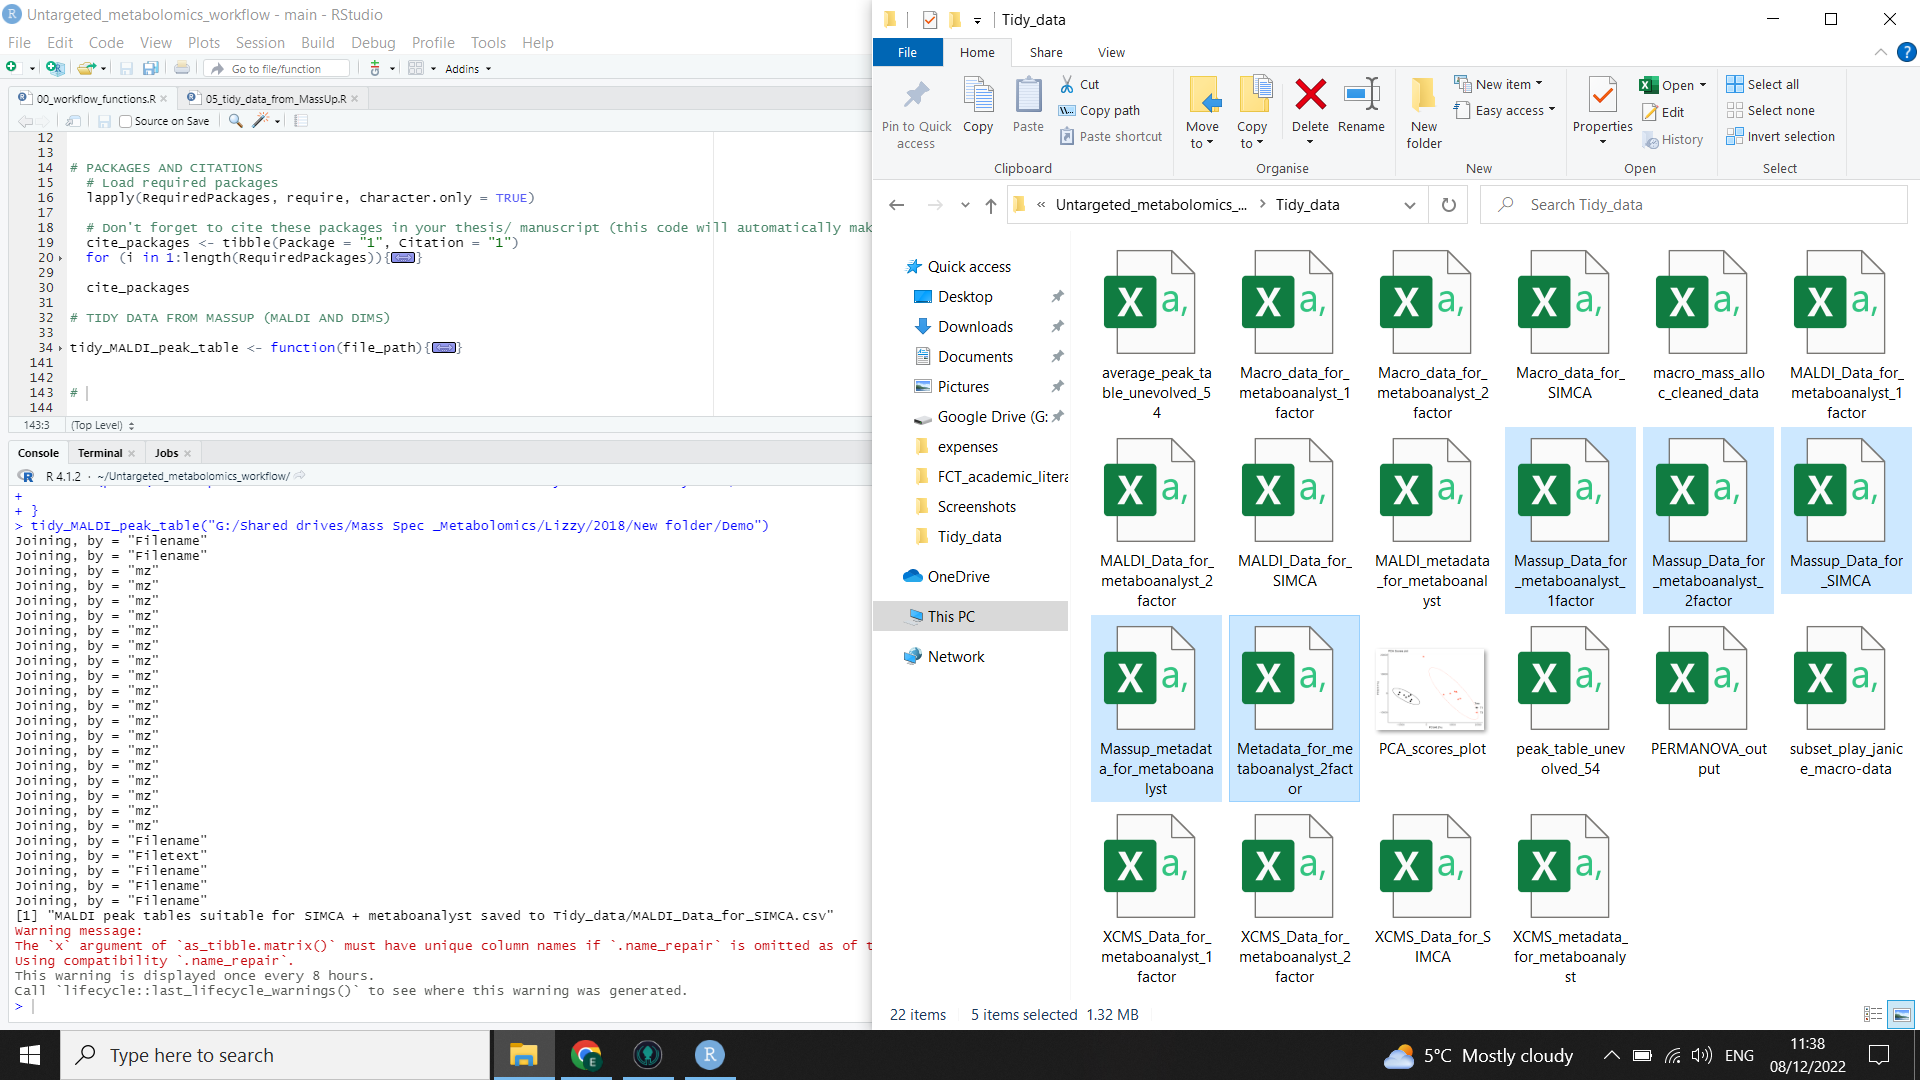
You now have peak tables ready for analysis. The file “Massup_Data_for_metaboanalyst_1factor.csv” will show your samples against the first factor, while the file “Massup_Data_for_metaboanalyst_2factor.csv” will show your samples against the second factor. The file “Massup_Data_for_SIMCA.csv” will show your samples against all factors and should be used on Metaboanalyst alongside the “Massup_metadata_for_metaboanalyst.csv” file.
⚠️ If you try to open these peak tables in excel, be aware that you probably won’t be able to view the whole file as excel has limits on the number of rows and columns