MSConvert DIMS
Convert direct injection ESI-MS data to open format
💡 When metabolome fingerprinting using DI-ESI-MS, we autoinject the sample over a period of time. We only want the scans from a certain range in the chromatogram - the range where the sample is.
Below is an example of the chromatograms we get from DI-ESI-MS:
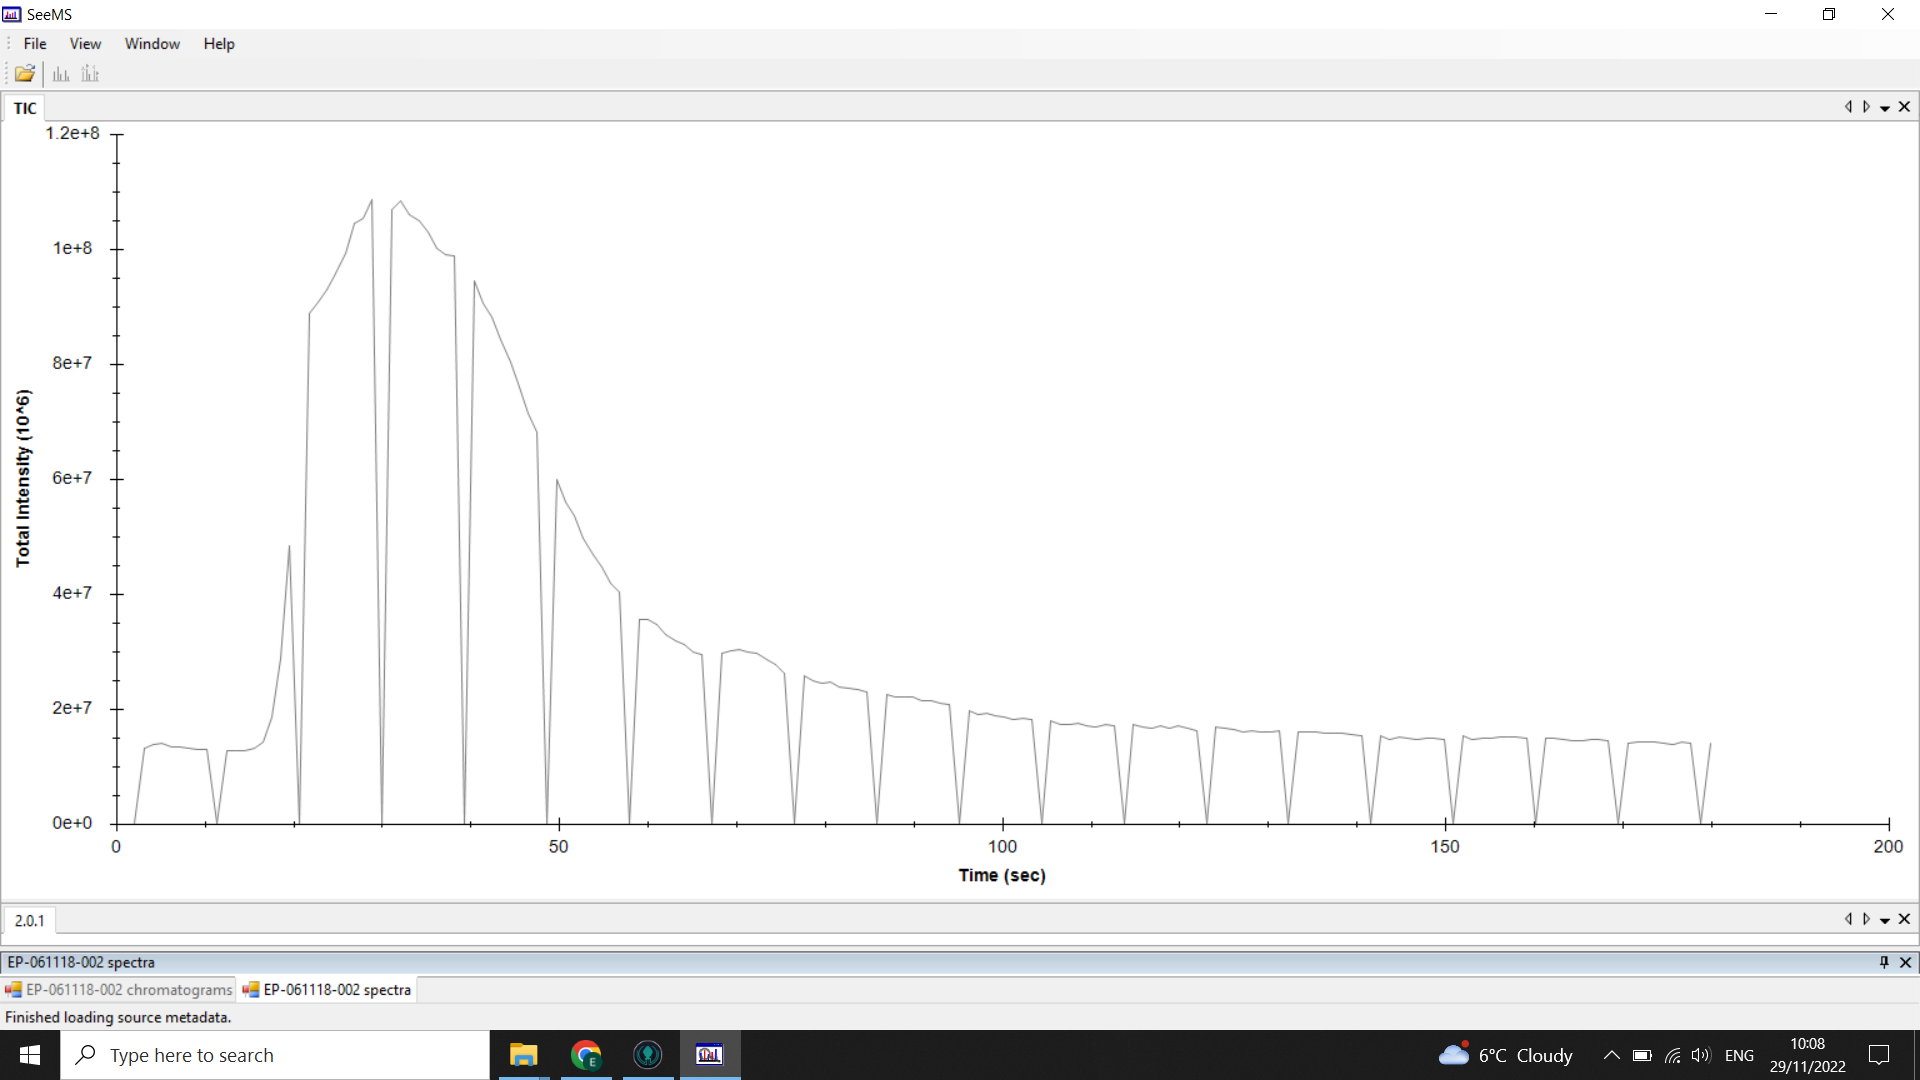
💡 In this example, the “troughs” or “gaps” in the chromatogram are where the optional lockmass calibration is performed during the run
Along this chromatogram there is a spectrum for every second (that rate is changeable but default is usually 1scan/sec).
The peak starting at 0.3mins (20 seconds) shows when the sample was injected into the flow.
The flat line before the peak is the signal intensity of the background noise, and you can see that at the tail end of the chromatogram the signal is back down to that level as the sample has been washed through.
We only want to work with the spectra around the sample peak, once it has all been injected the signal steadily drops as the sample is washed out.
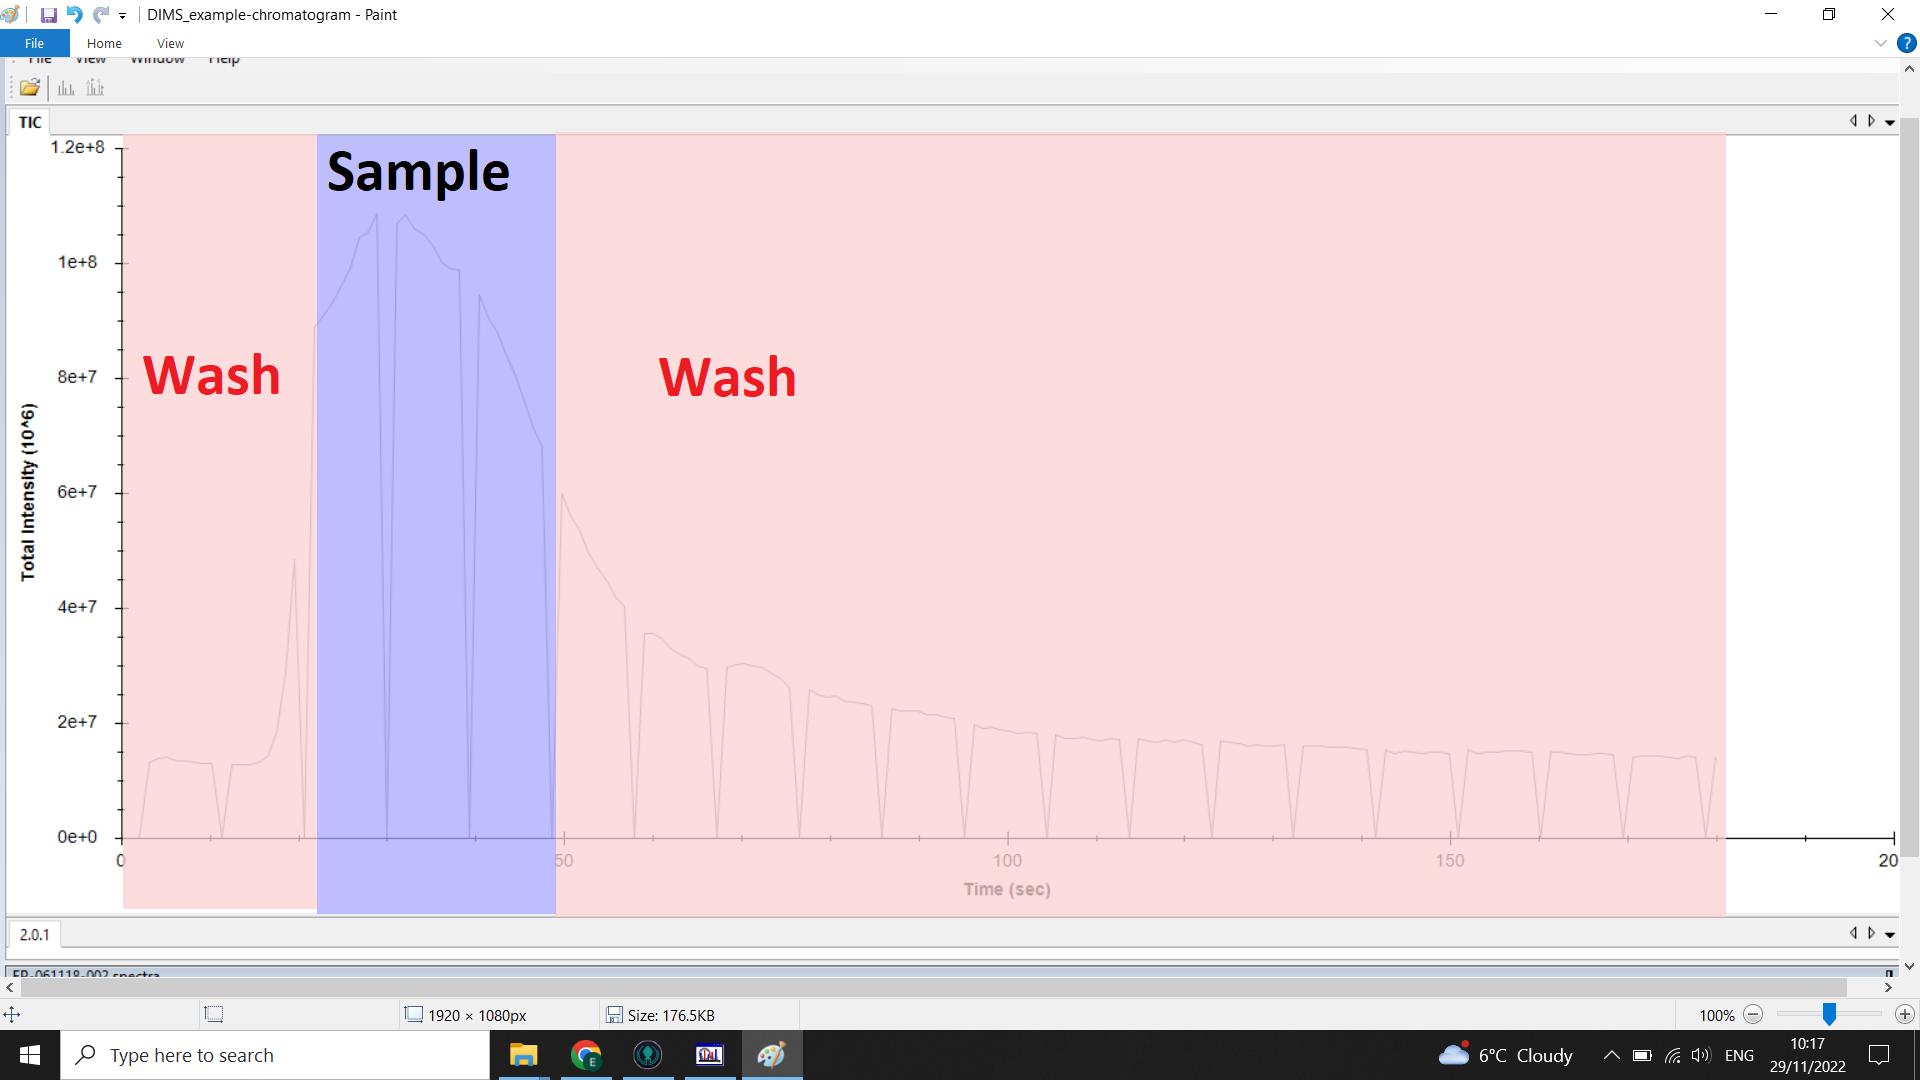
The image below shows the range of the chromatogram we want (blue) and the range we want to remove (red):
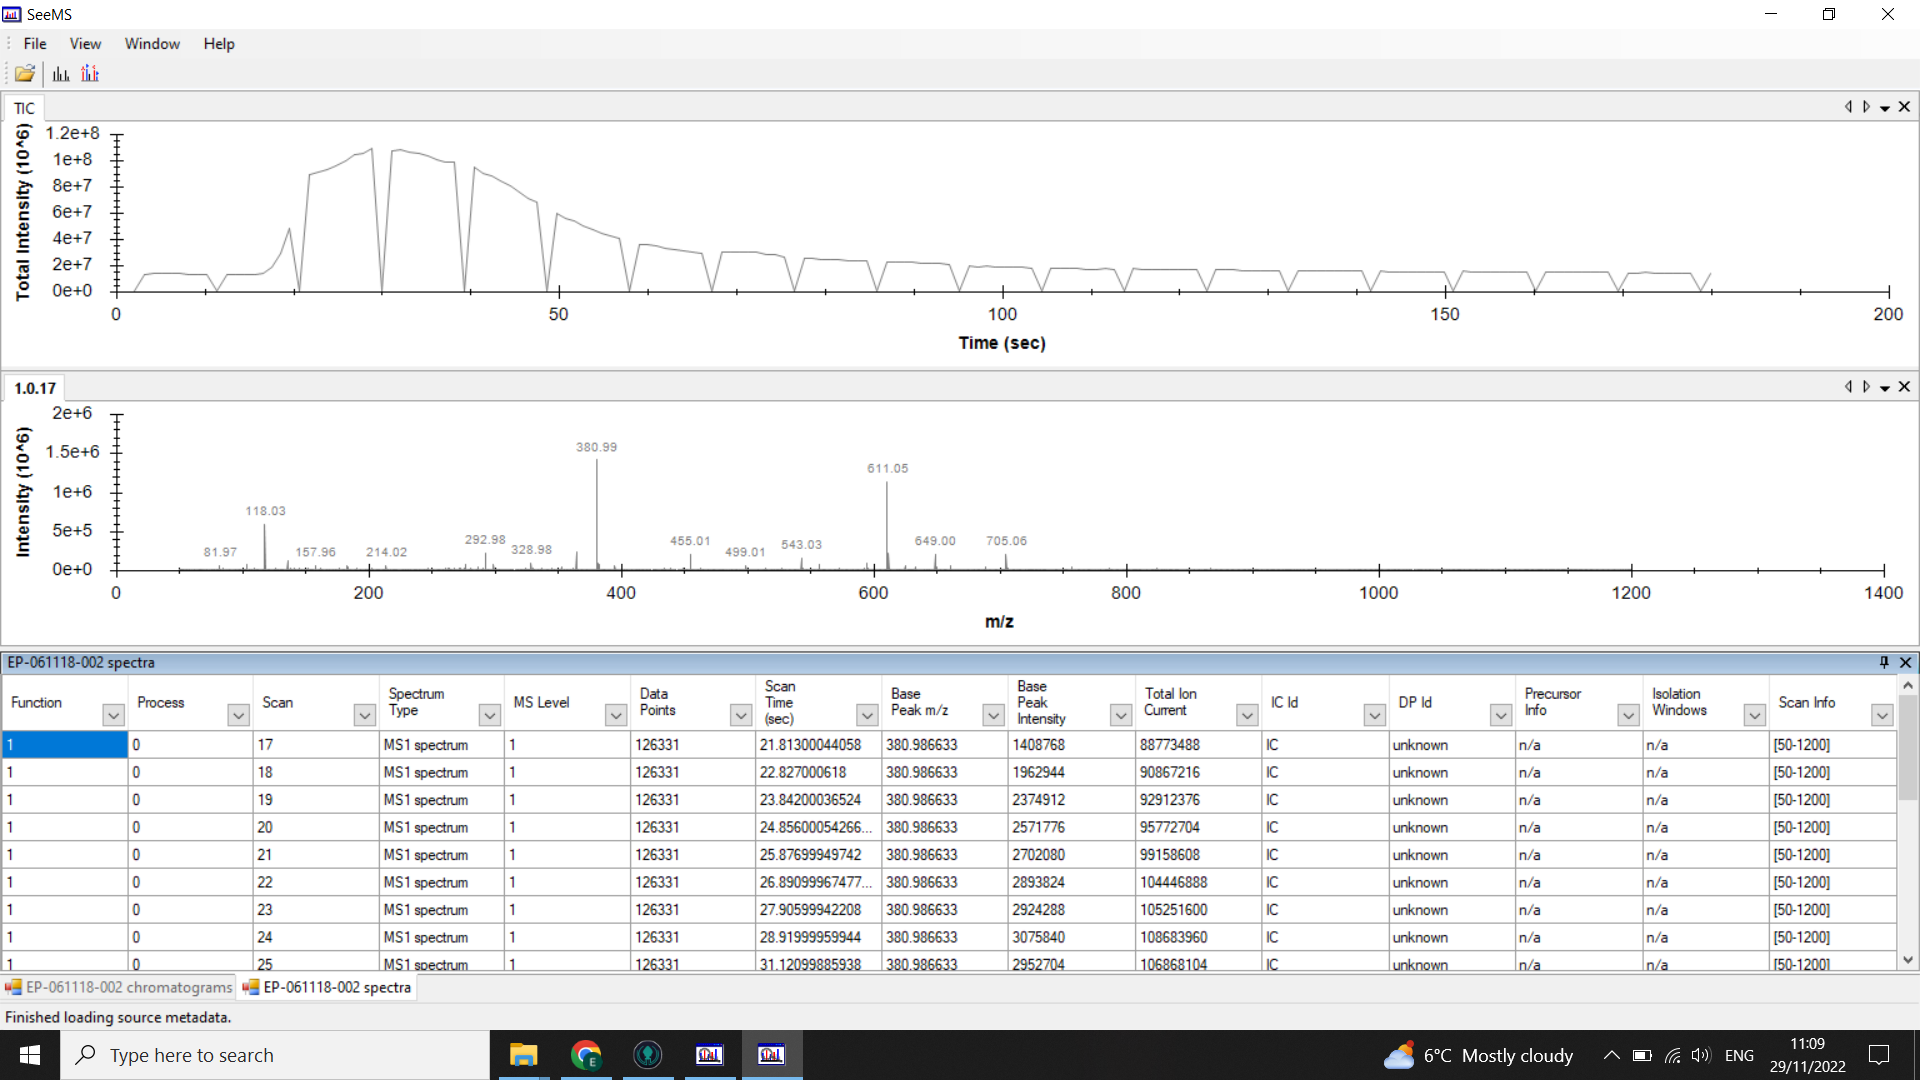
Checking the scan range you want
Open SeeMS, and select a .RAW file from early in your run. This will load:
- a chromatogram
- the first spectrum from that run
- a list of the spectra
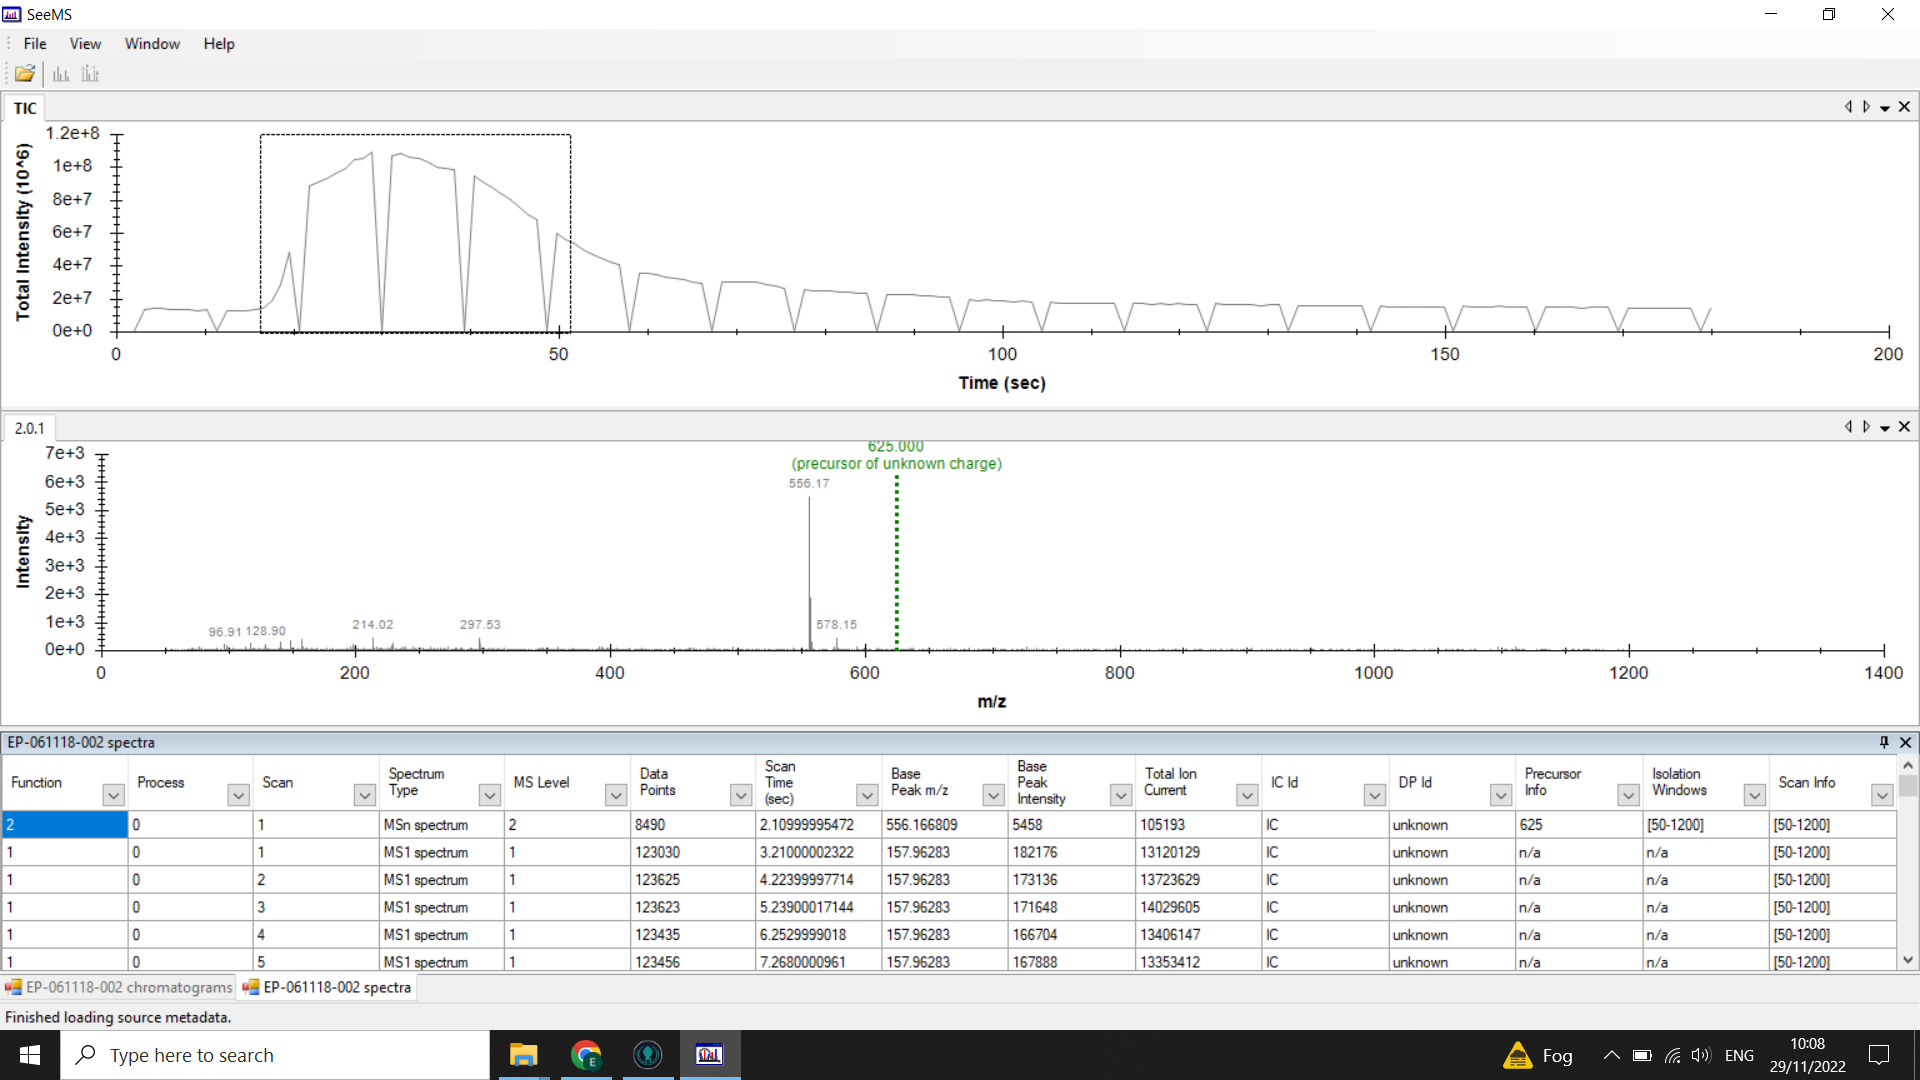
Identify where your sample peak is in the chromatogram and choose a scan range that covers this peak
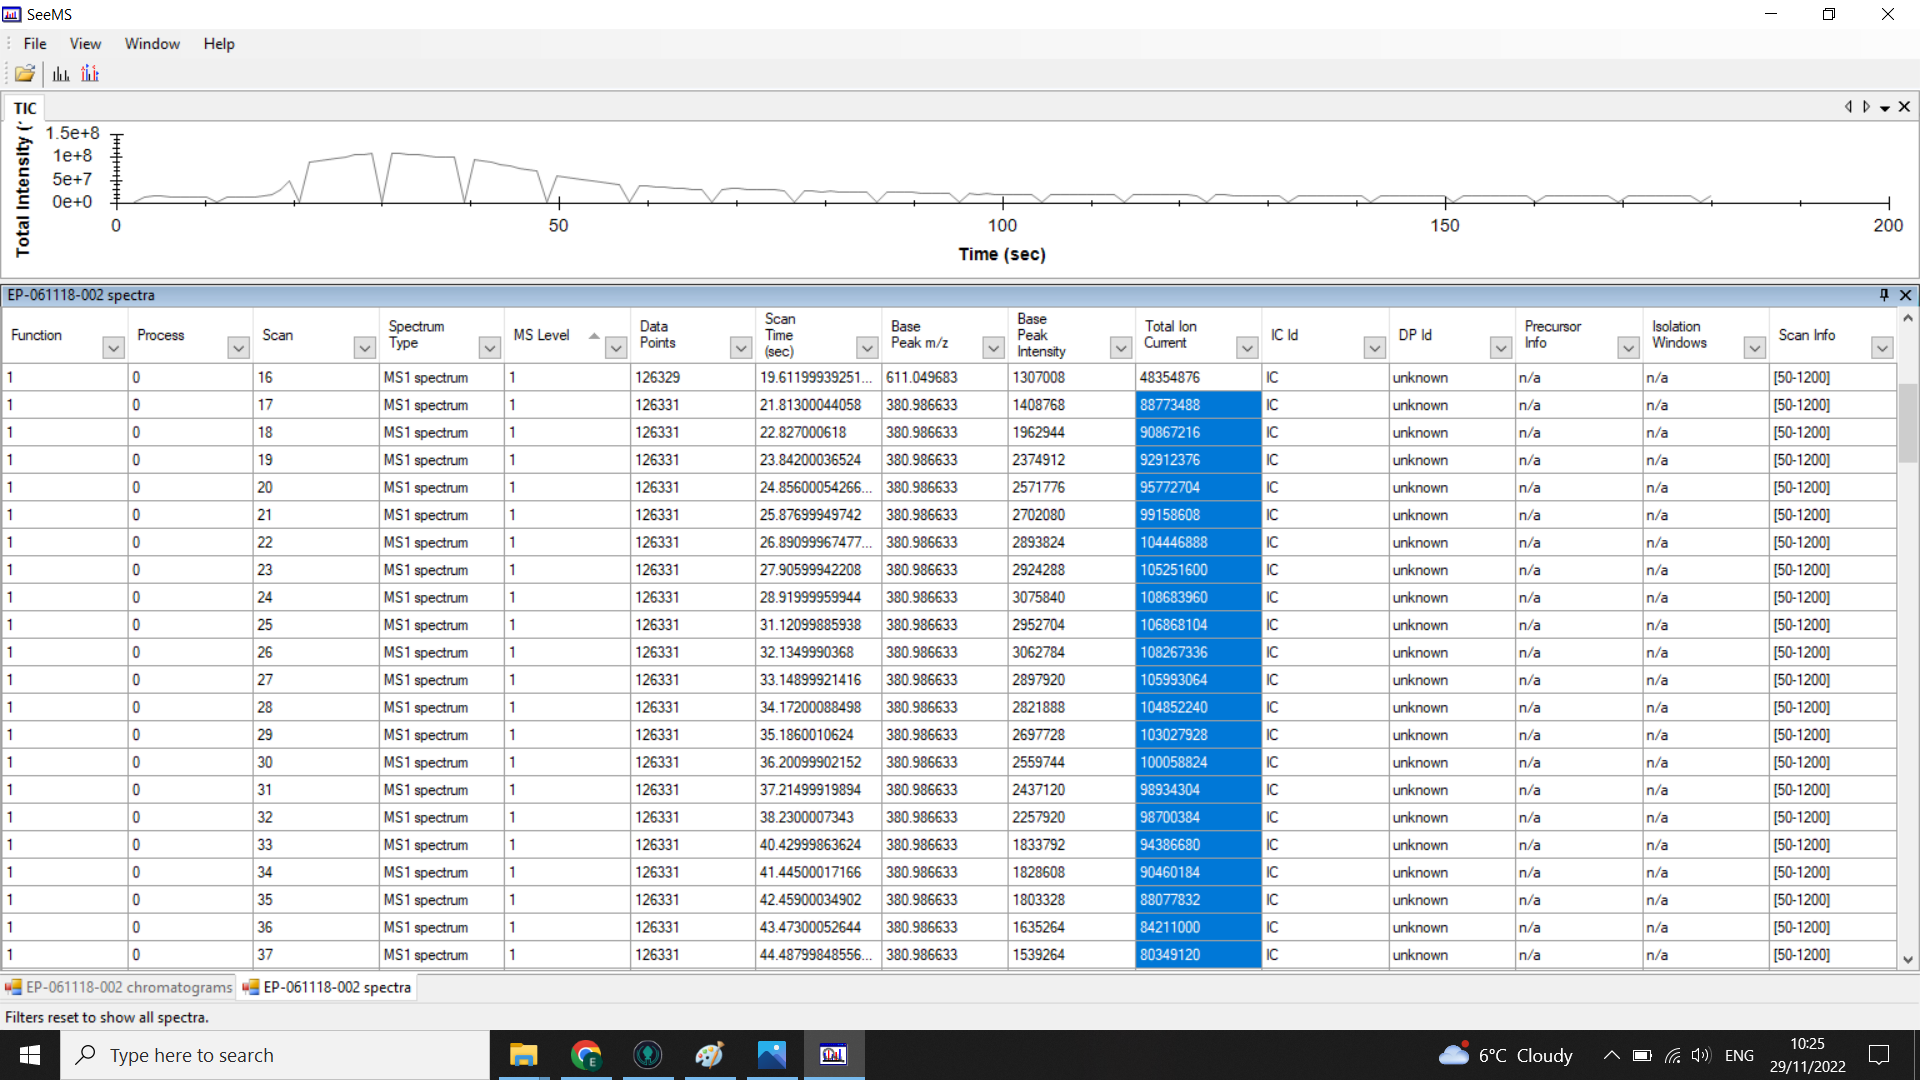
In the example above the peak is centred on 0.5mins (30 seconds). Looking at the spectra list given below the chromatogram we can see that the TIC is high from spectra 17-48 so we would choose a 20 spectra range from within these boundaries (here I have selected 17-37).
⚠️ Scan range should be the same throughout the run. 20 scans is the minimum number, you can do more if you have a much wider peak. Before you decide on your spectra range, check that chromatograms from later in the run also fit in this range. Over long runs there can be a bit of a lag build up and samples may be injected a couple of seconds later, shifting the whole peak to the right slightly. So check that your chosen range fits chromatograms from the start, middle and end of the run.
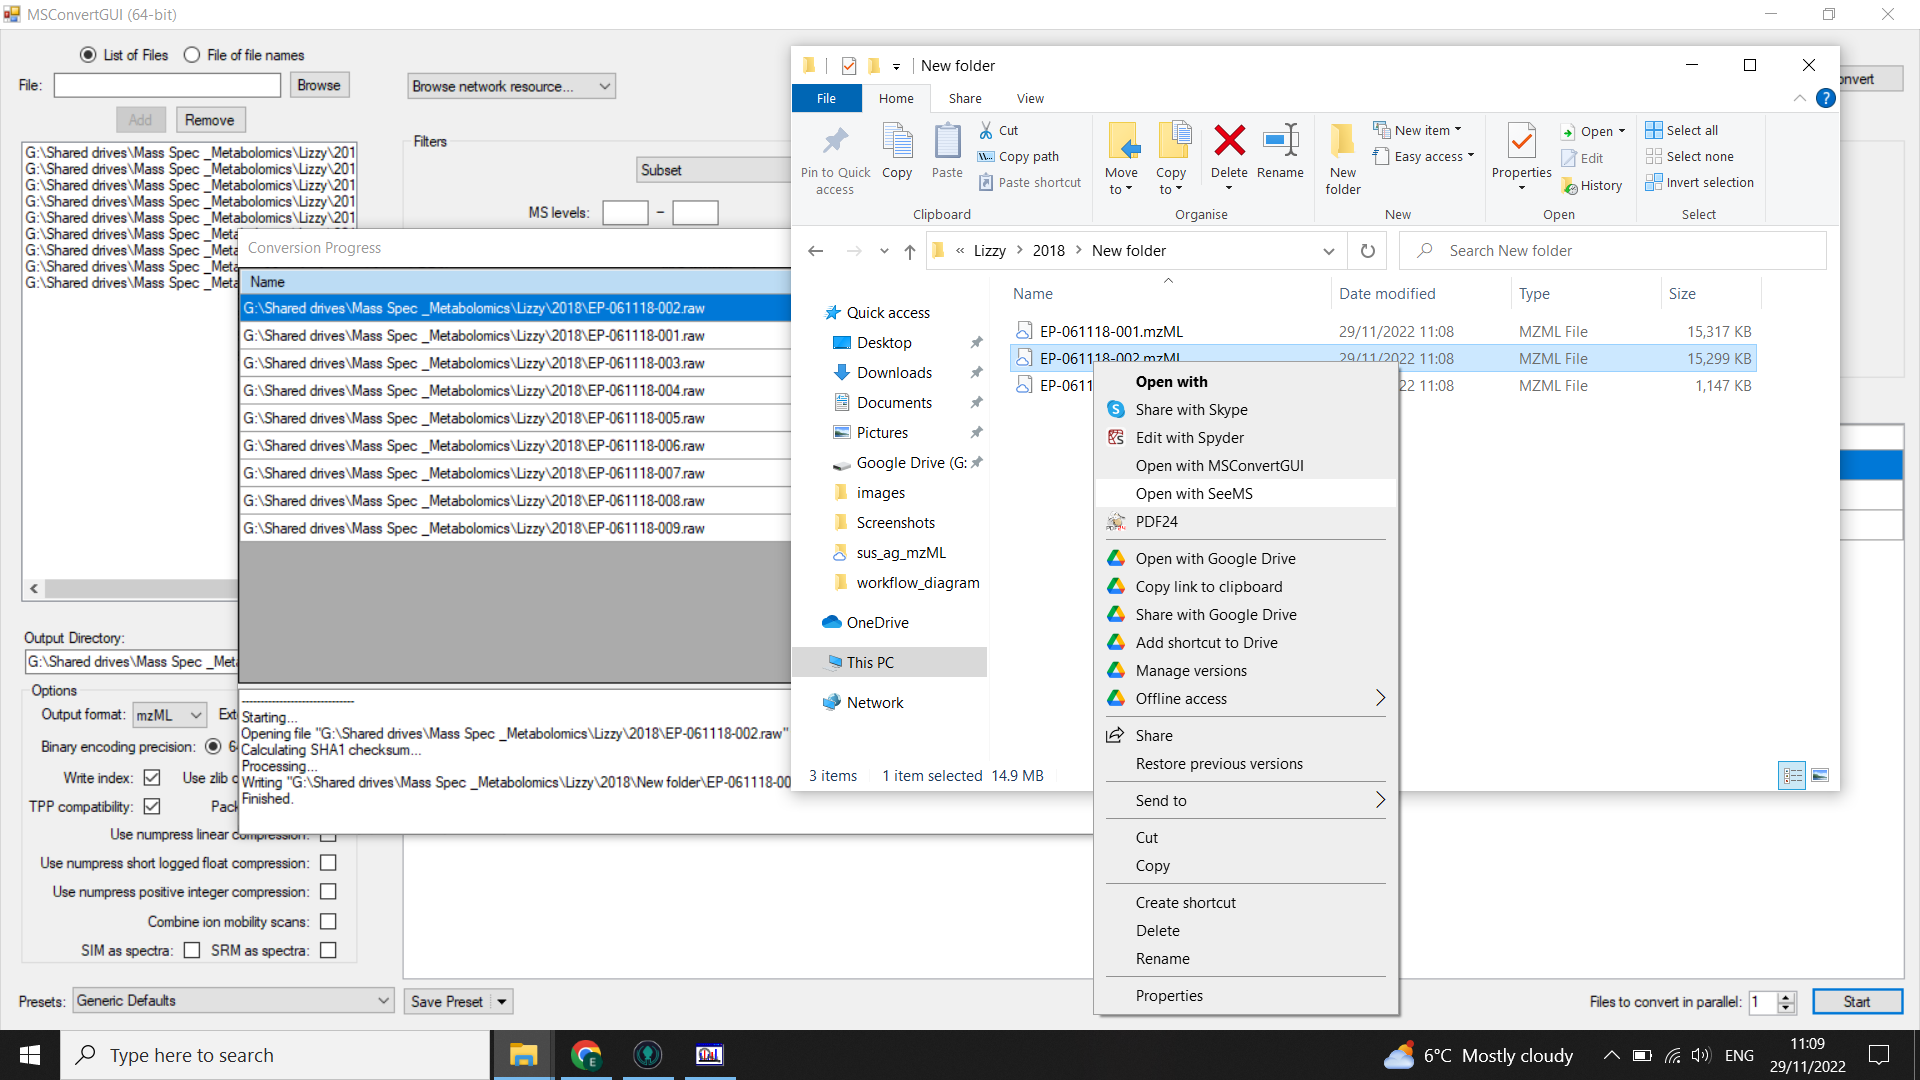
File conversion
Open MSConvert
⚠️ If you are using a remote drive (e.g. google drive or onedrive) with a slow connection it is worth doing your conversion in small batches so you can check the file size as you go - if you are seeing big discrepencies you need to go back and check the sizes of your original files. Some files may need re-converting if your connection times out during the process.
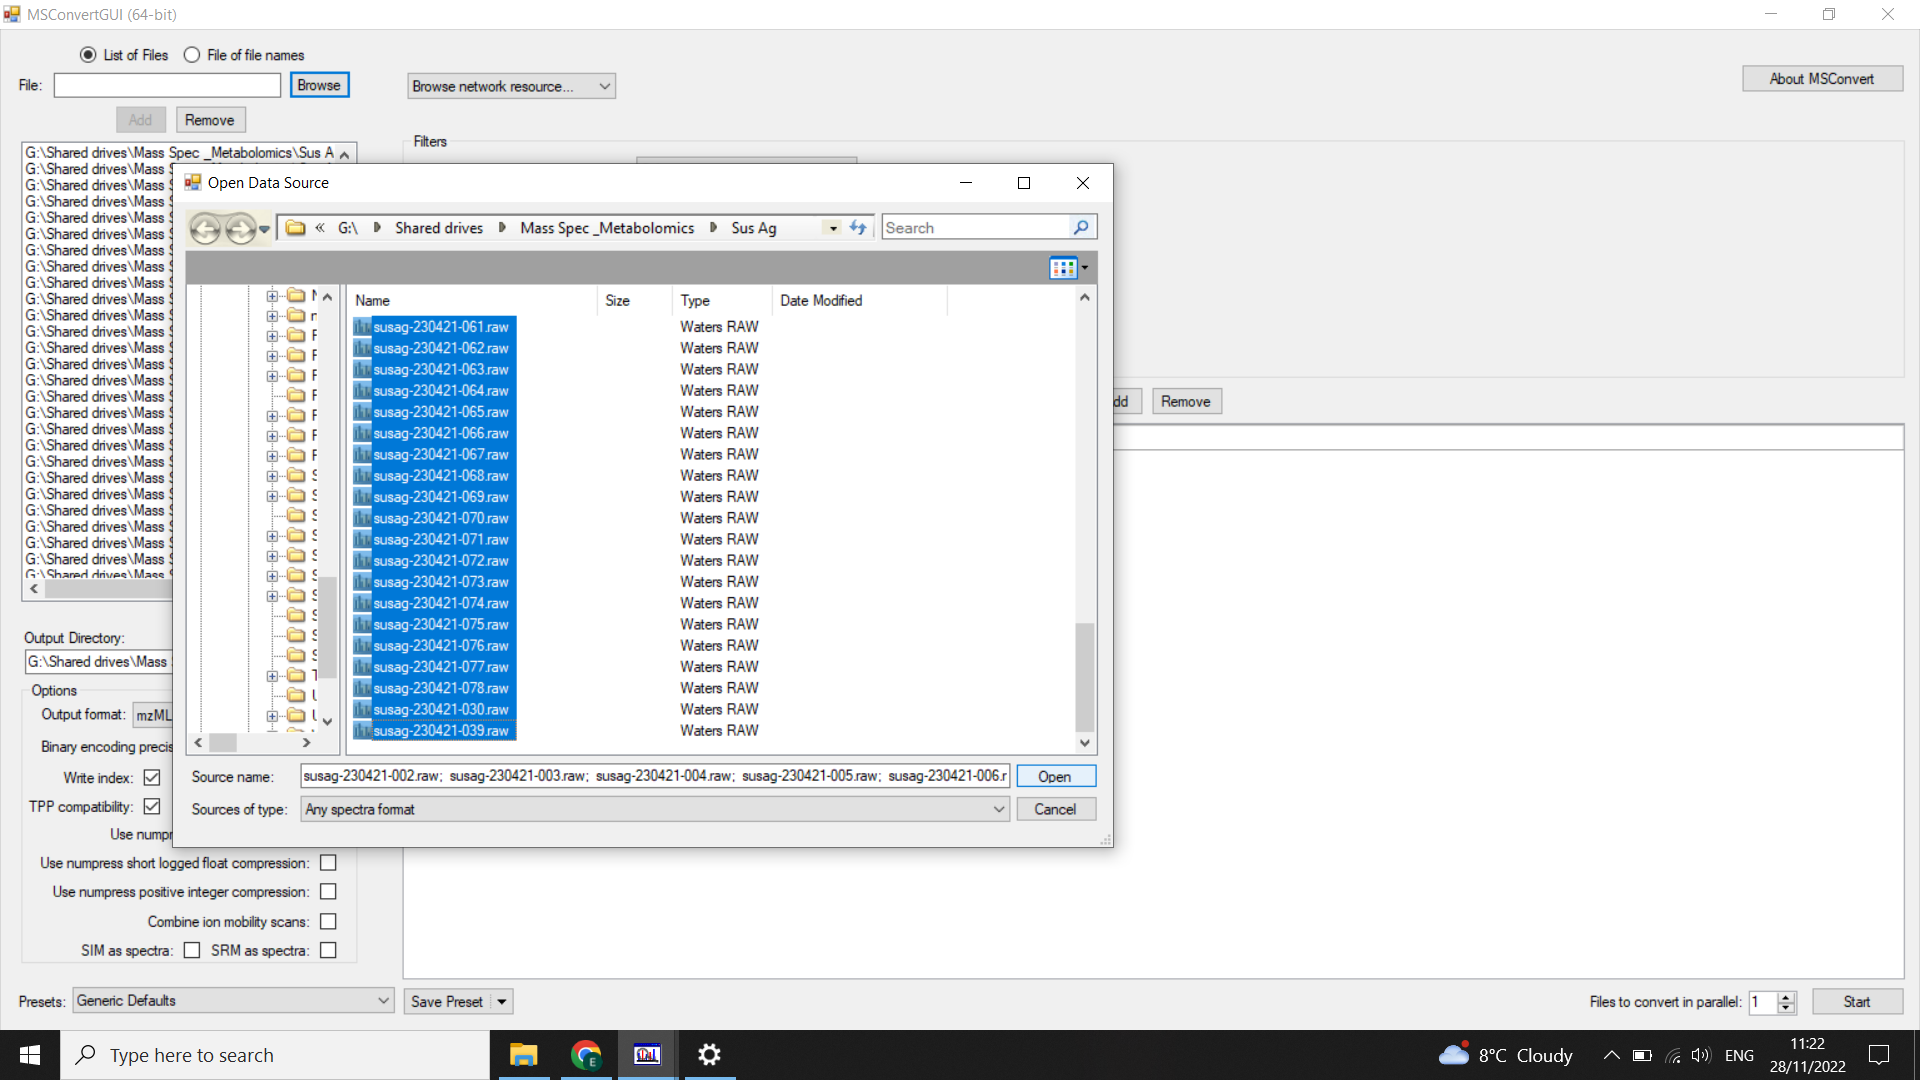
File: “Browse” > Select .RAW folders to convert
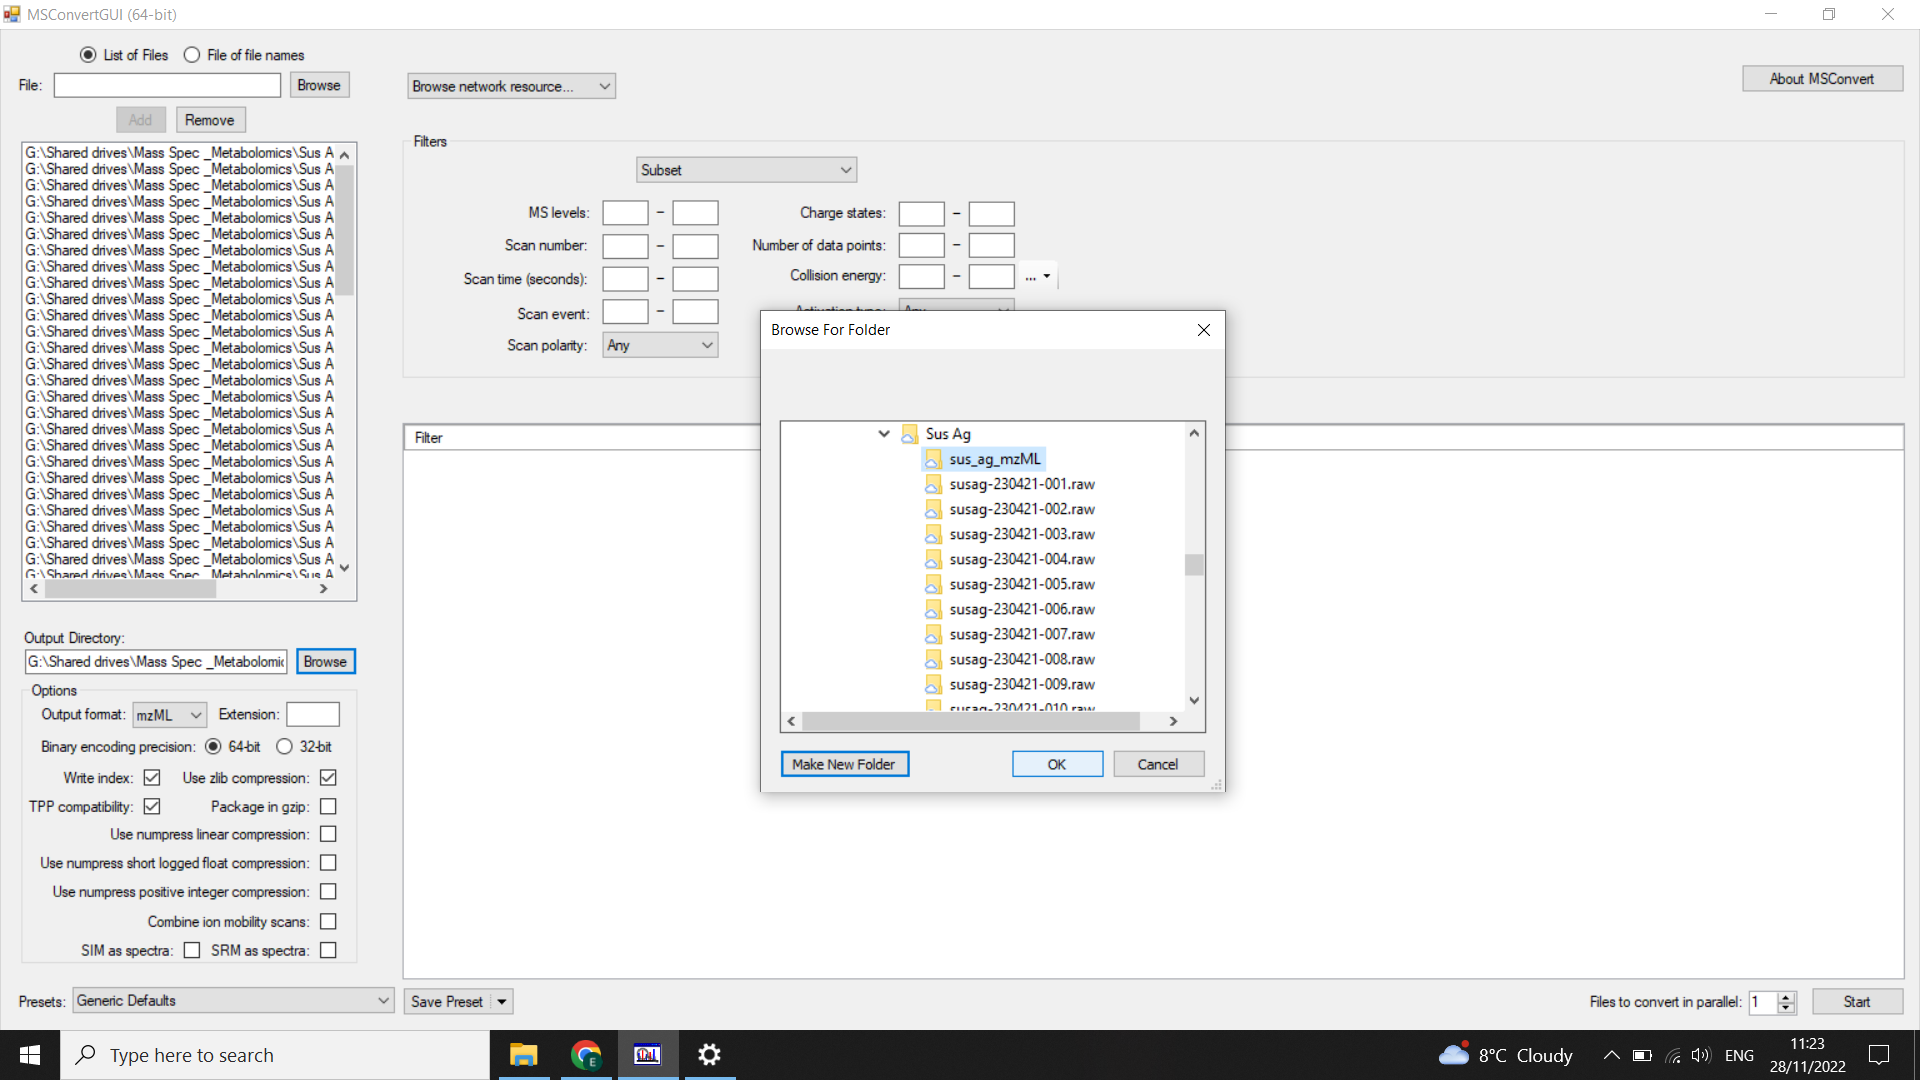
Output Directory: Specify an output folder using “Browse”
Options: Output File > mzML
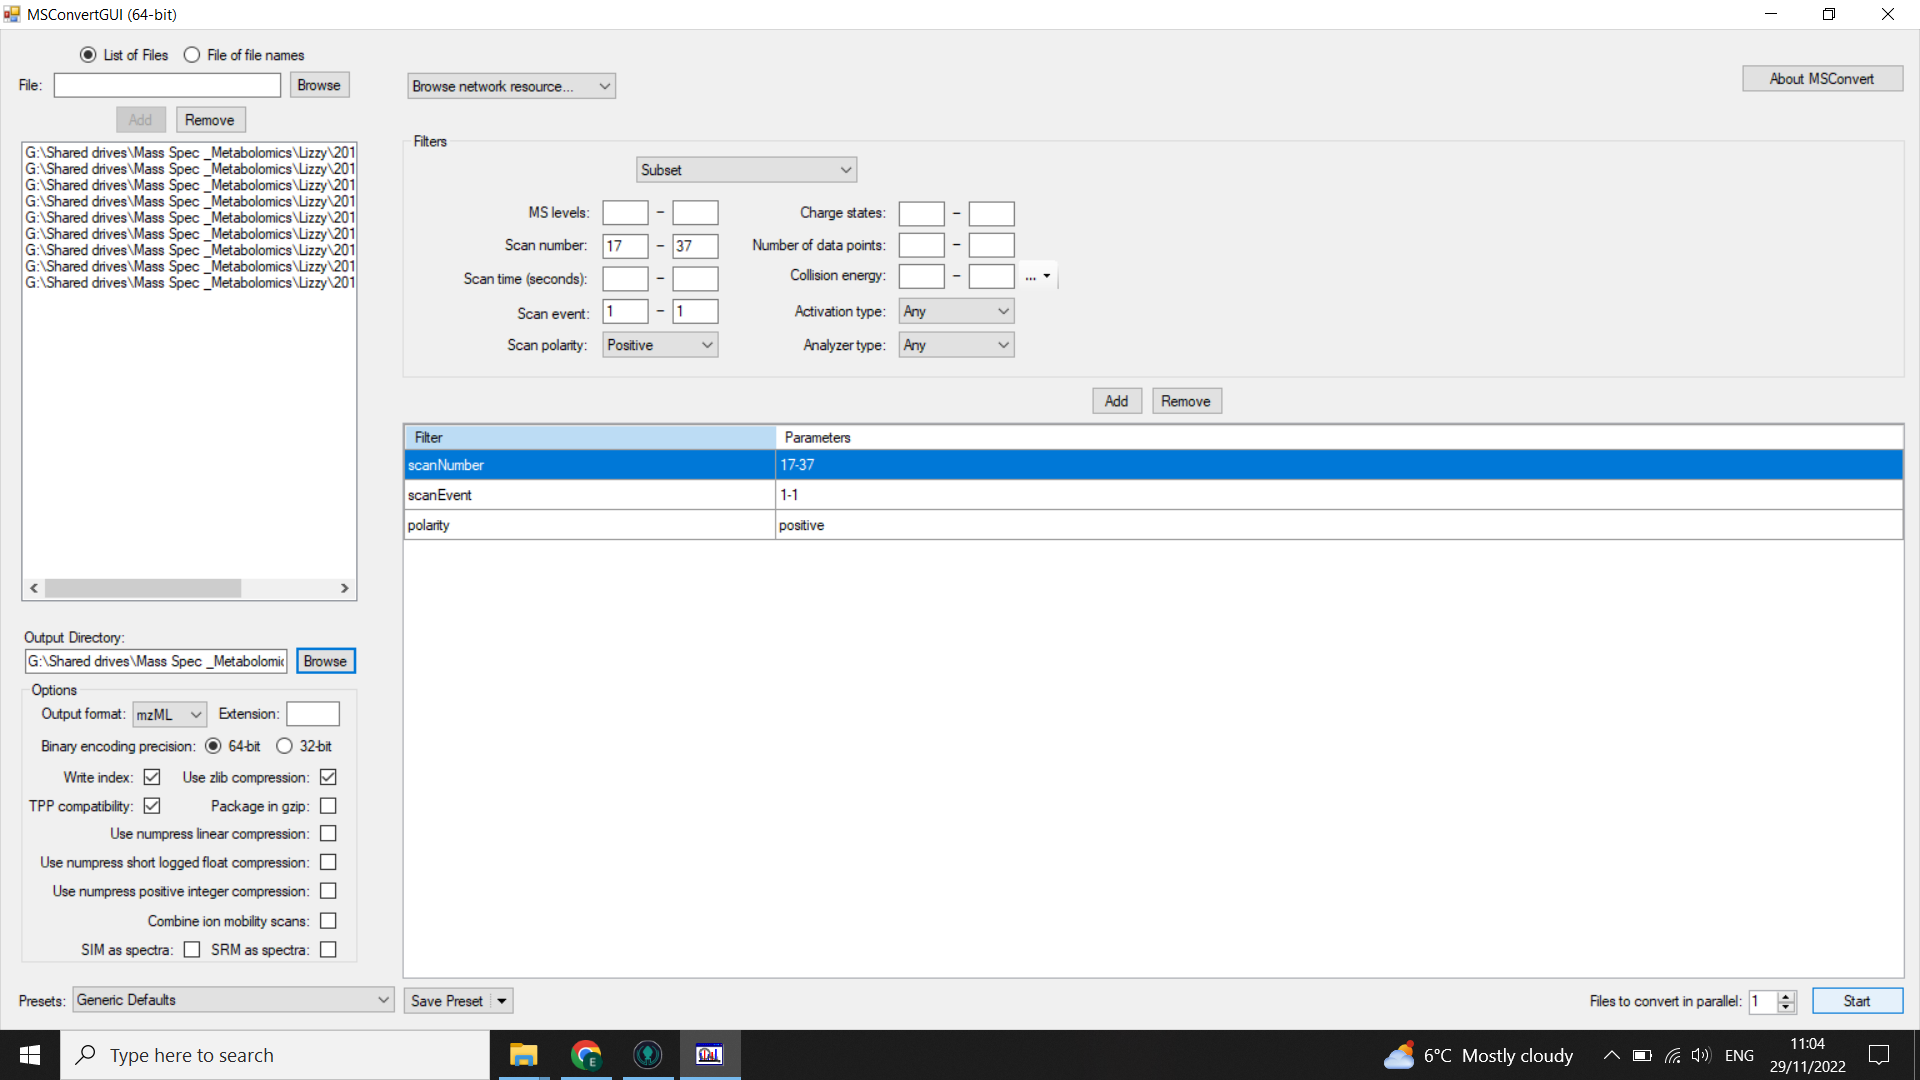
Filters: select “subset” (from drop-down menu) and then:
- select “scanNumber” = 17-37 (use your scan selection from when you checked the scan range)
- select"scanEvent” = 1-1
- select “polarity = positive” or “polarity = negative” depending on your MS run
Click “add”
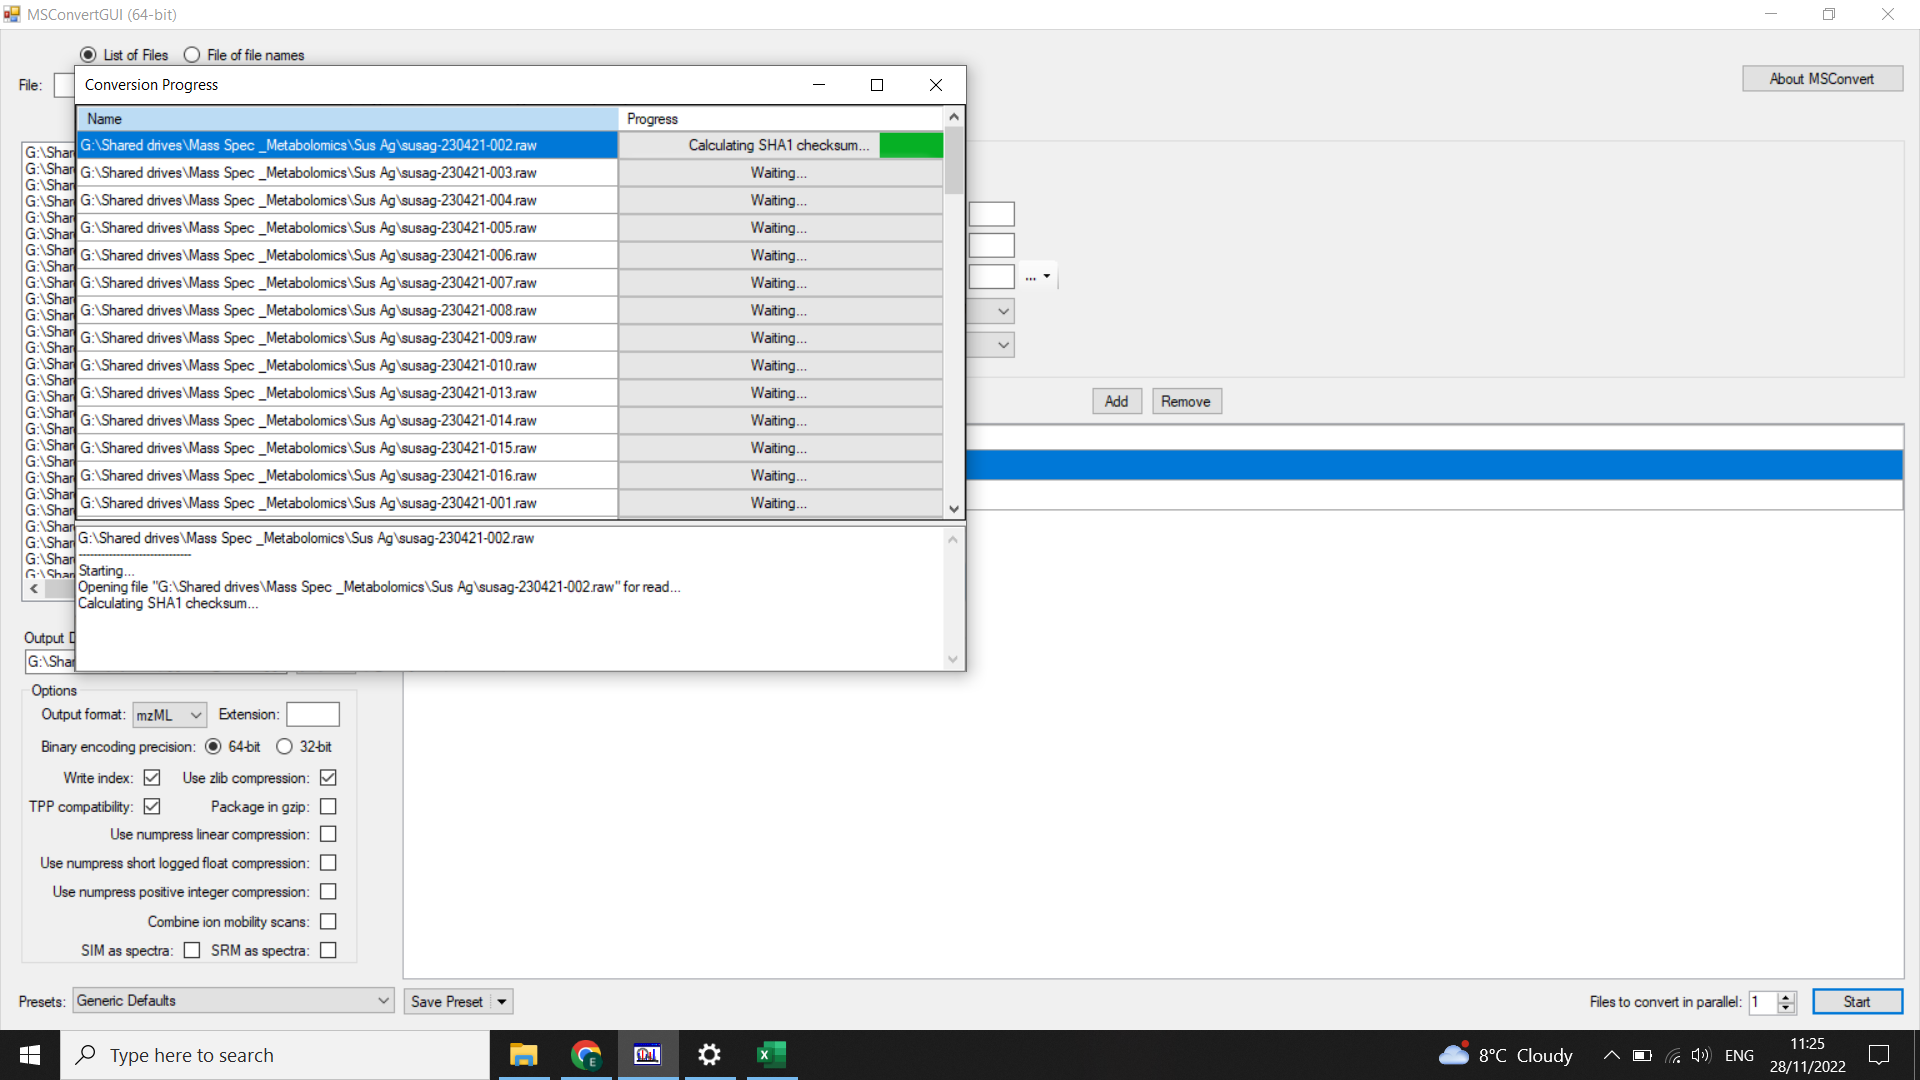
Select “Start” (bottom right)
💡 For DIMS data we do not perform PeakPicking during conversion because we need to maintain the profile shape of the data (rather than centroiding)
Check the size of .mzML files - should all be similar. Reconvert any that look small. If you consistently have some that are much smaller, it is worth checking whether these ran properly or whether there were any issues copying or converting the files (such as intermittent internet connection).
When you look at the .mzML files using SeeMS, you will still see the full chromatogram, but if you look at the table of spectra underneath, you should only have rows for each of the scans in the range you specified.
⚠️ If you have any big gaps or empty tables when you look at your chromatograms/ spectra in SeeMS, then you should go back and redo the conversion.